IN THE GRAPHIC REPRODUCTION PROCESS
Mahovic, S.; Mandic, L.; Agic, D. & Gojo, M.
Abstract:
Developing and reproduction through the Computer to Plate (CtP) systems bring out a number of novelties, even in the field of different screening methods. The conventional screens (amplitude modulated screening method - AM) are still being used due to their predictability which comes as a result of their longer usage in the printing process. In certain types of reproduction the usage of frequently modulated screening method (FM) is becoming wider. In this paper the original was reproduced by using the AM and the FM screening method in the same CtP workflow, after which it was printed in offset. The differences in the quality of prints have been defined by measuring the mechanical and the optical characteristics of the screening elements. The results of the instrumental measuring have been confirmed by visual assessment. Different models and conditions of the usage of certain types of screening elements for characteristic motives reproduction have been suggested.This kind of investigation will simplify the process of deciding which screening element will find use in the graphic reproduction. The proposed new screening method will correct the disadvantages of the investigated screens.
Key words:
AM and FM screening methods, CtP technology, print quality
1. Introduction
Most of the photographic images have been printed using the same technique, called screening. It converts shades of gray into small black dots arranged on a grid. Different shades of gray are simulated by adjusting the dot size and the density of the grid according to the screening system.
Unlike photography, differences in lightness can not be directly reproduced in offset printing (Wadle & Blum, 2002) . Printed paper either has color or none at all, meaning there is no such thing as ‘a little color'. However, screens trick the human eye into thinking that it sees differences in lightness. In a black-and-white image, different gray tones can be simulated by printing a number of small dots larger or smaller. These small dots are arranged at regular intervals in a grid structure that is called a screen.
The relationship of the dot size to the screen mesh or halftone cell, to use the technical term, results in a dot percentage that gives the optical illusion of gray. Whether or not the individual dots can still be recognized depends on their size and on the distance from which they are observed. The classic screen with a regular, usually square grid structure has a screen period and a screen angle. The reciprocal of this period is called screen frequency or screen ruling and is usually measured in lines per centimeter. To keep things simple, the dot shape is depicted here as a circle, although dots can come in elliptical, square, round-square, rhombic or other shapes, and the shapes within light, middle and dark areas may vary yet again. Today, there are many different screening methods which suit to the certain reproduction system. Usually, screening is used as a helpful tool for producing print media, but in some rare cases it is also used as an artistic design element. Accordingly, the screen should not be visible or if so at least not in a disturbing way. The principle used in black-and white printing can be applied to color printing as well. Every color image can be broken down into process color separations with the help of suitable filters and can be printed with the help of screening. That is actually all there is to screening. Screening is the art of being able to use only three solid tint colors and black as a contrasting color to simulate a natural-looking color image. As with all forms of art, screening requires substantial expertise.
2. Background
The amplitude-modulated (AM) screening method consists of dots of different sizes according to tone value, but at the constant distance from one another (Fig. 1). In contrast, frequency modulated screening method (FM), places identical size dots in a random pattern to simulate a continuous tone image.
While half toning uses a straightforward, deterministic translation scheme - each input level of gray matches a corresponding dot size and position - stochastic screening employs mathematical uncertainties. Depending on the type of stochastic screening used, dots of ink can vary in size, frequency, or even shape. Dots are spaced irregularly at a frequency that depends on the image gray value. There is a fixed dot size arranged closer together or further apart to represent different shades of gray. By enlarging the surface coverage (density) the number of dots is being enlarged as well, to the point of touching or even folding over. The reproductions made by using the FM screening method are of color photography quality, gradients are more correctly defined and the trapping is better than the one with the AM screening method (Levien, 1995) . The sharpness of details obtained by this method is impossible to reach by using any other screening methods. Because of this the usage of the FM screening method in the technologically highly demanding reproductions is most frequently recommended in the literature. The development and the employment of FM screening was certainly quite a revolution in the digital printing. Based on the fact that a FM screening has a very good visual quality and is free from moiré or rosette, the prevailing assumption was that the FM screening would become increasingly widely used in the graphic arts industry (Wadle & Blum, 2002).

Fig. 1. FM and AM screening with a digital dot structure (Kipphan, 2001)
In practice, however, the amplitude modulated screening methods are still predominant.For the reason of some technical problems FM screening survives only in some packaging applications where six or more color printing is popular and screen clashes are to be avoided. The repeating of the same procedures in certain intervals tends to be a problem. The every day printing practice has shown that it is not possible to achieve the equal reproduction quality by reproducing the same original with a slight change in e.g. text, along with the reproduction of adequate control wedges in the same workflow conditions (Ward, 2003). In spite of the disadvantages above mentioned, printing houses tend to use the FM screening technology more and more every day. The screening methods are being improved by the development of the digital technologies (especially CtP) (Adams & Romano, 1996). Prior to the transition to CtP platesetting, a printer's ability to hold dots in low-density areas was difficult. As CtP gained followers, FM screening also became more popular.
3. Exprimental part
The aim of this paper was comparing the AM and the FM screening methods by reproducing the original on the same CtP printing plate and on the same print sheet. The linearization and the process calibration were carried out before reproduction. The original consisted of a number of test charts with fields were reproduced in the same printing conditions. Reproduced test charts were enabled the quality control of the prints, according to the prevailing colors and tones on the original. It has classical offset rosette, control fields for CMYK with different screening elements coverage, gray tone scales, solid ink patches for CMYK and RGB overprints, and characteristics color photos. Computer generated values from 10% to 100% coverage of the screening elements on the digital printing plates and transfer of these values on the prints were investigated. For measuring the mechanical characteristics of the plates and prints the device with the CCD camera has been used. The dot gain has been calculated as the result of measured values.
The spectrophotometric measurements were done on the solid ink patches for CMY and RGB overprints. The obtained spectral data have been transferred into LAB values and the color gamuts, lightness, hue and saturation of the observed prints have been defined (Wiszecky & Stiles, 1982). After the mechanical and optical measurements of the prints the visual analysis was made (Fairchild, 1998). The visual assessment was made by a hundred of students. The viewing laboratory equipped with the D65 lamp and an interior painted neutral gray was used for this purpose.
4. Results
A colour gamut is simply a range of colours. For an output device like a printer, it is the entire range of colours that the device can produce. In contrast to faithful reproduction , in the editorial section of newspapers and periodicals the aim that is frequently pursued is the reproduction of the original images so that they are attractive (Kipphan, 2001). The terms appeal or intention-optimizing reproduction can be used here. In this sense the term appeal-optimizing can be interpreted in various ways. The transparencies supplied by photographic agencies often have a considerably larger color gamut than the printing technology utilized, so that compromises have to be made during the conversion of the image information into print. The other factors that determine the quality of a color reproduction depend primarily on the characteristic properties of the ink, the substrate, the printing technology utilized, the printing conditions, the nature of the original, and the separation parameters. The colorimetric properties of the ink utilized and of the substrate have a considerable influence on the reproducible color gamut .
To visualize a printer gamut, the solid ink patches of the primary colours (Cyan, Magenta and Yellow) and on the solid ink patches of the secondary colours (Red, Green and Blue) of the subtractive synthesis were printed. The measurements of each colour patch for the the AM and the FM screening methods by using a spectrophotometer were taken and the results were drawn in the CIELAB color space (Fig. 2). In comparison, the CIELAB values from were presented. As the figure shows the results of the measuring were balanced due to the fact that our samples were reproduced using the same system and the reproductive capability of certain system is determined by the gamut color space. On the prints reproduced using the AM screening method there is a slight decrease of the cyan and green colours.

Fig. 2. Colour gamut in CIEL*a*b*diagram.
The quality of the tone reproduction of the different screening methods has been observed by measuring the mechanical characteristics of the printing elements on the printing plates and the screening elements on the prints. The results of the measurings for the CMYK colours are shown in the figures 3 to 6.

Fig. 3. Coverage on the printing plates and on the prints (cyan).

Fig. 4. Coverage on the printing plates and on the prints (magenta).
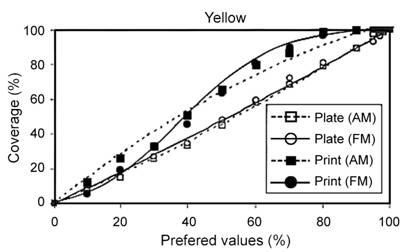
Fig. 5. Coverage on the printing plates and on the prints (yellow).

Fig. 6. Coverage on the printing plates and on the prints (black).
The figures show that the surface coverage of the printing plates is balanced in the places of all colours in the both screening systems. In the AM screening method there is a balanced increase of coverage on the CMY prints, and a slight change arises only on the K prints. The prints made by using the FM screening method show the decrease of the coverage on the light tones (for CMYK). These prints also show the increase of coverage on the middle tones as well as significant increase of the coverage on the dark tones.
The dot gain has been determined considering the different reproduction of the middle tones in both reproduction systems (Fig. 7). The results show that the increase of the coverage is slightly bigger on the prints made by using the FM screening method.

Fig. 7. Dot Gain at 50% of coverage.
Because the colours differ in directions of lightness and saturation the parallel monitoring of both parameters is most often performed to get the more precise investigation results (Hunt, 1991).
The measurements were performed on the solid ink patches for CMY and RGB and are shown in the figures 8 and 9. Because of more accurate colour description the hue angle has been defined as the attribute for defining the difference between the two colours (Fig. 10).

Fig. 8. Measuring results of lightness on samples.
Fig. 9. Measuring results of chroma on samples.

Fig. 10. Measuring results of hue-angle on samples.
For comparison of the reproduction results, the values on the computer-generated original are presented. The values of lightness and saturation for AM and FM screening methods are somewhat smaller than on the original, and they differ slightly. Such differences were expected. It is known that the technological limitations of the production process will cause the decrease of the area of the print reproduction, so the properties of inks and printing substrate, conditions of screening, characteristics and quality of the original as well as the parameters influencing the colour separation will also have important role. Because the original was reproduced in the same condition, identical differences appear in both screening systems. There is somewhat greater difference in the measured hue values, where cyan, yellow and blue have uniformly been reproduced, and magenta shows the hue increase, and red and green show the decrease of values reproduce by FM screen.
5. Discussion
The results of the measurings of the prints show that with the FM screening system there is a decrease of the coverage on the light tones, which causes poorer clarity and losses on the motives with prevailing light tones. These changes could come as a result of using very small FM screening elements (21 m m) which simply disappear in one of the phases of the reproduction (for example in the plate developing process) or as a result of unbalanced relation between the fountain solution and the ink. These changes will have influence on the reduction of the ink transfer and on the reduction of the surface coverage on the prints (Agic et al., 1999). The increase defined on the middle and dark tones in the FM screening system causes more saturated prints as well as quality losses in the reproduction of the dark tones and shadows.
As some determined irregularities appear in the application of FM screen, which are the advantages of its commercial usage? To answer this question easier, AM and FM reproduction of the same original were tested by visual method. Three groups of reproduced photographs were observed. The light tones dominated on one of them, different tones on the other and the dark tones on the third one. For evaluation of samples, two groups of fifty people were taken (ageing between 25 and 40 years). The observers from the first group were professionally bound to the printing profession, processing the colour photography and printing. The observers from the second group were chosen at random and had no connection to graphic arts. The investigations showed interesting results. The group of the observers with the knowledge from graphic arts declared themselves almost 100 % in favour of the application of AM screen as the prevailing one in the graphic production, with the designation on the rosette reproduction as the reference field for the presentation of possibilities and the advantages of FM screen. The photo with the prevailing lighter tones pointed at problems wile reproduction with FM screen, where the dot size of 20 m m showed to be relatively stabile in printing, but not stabile in the reproduction of the lighter tones. On places of the tonal gradations the usage of AM screen proved to be more applicable. 80% of the observers group who were independent on the graphic arts declared themselves in favour of FM screen application. Based on the photos with the prevailing coloured tones, reproductions from the nature (sky, sea, grass and fruit), the greater dot gain influenced their evaluation giving the reproduction of the more saturated tones.
From those entire results one can say that the visual assessment brought relatively equal results as the instrumental measuring. The motives with prevailing light tones are of higher quality when reproduced by using the AM screening method. The details on the prints are better expressed with the FM screening method but the quality of the prints with the dark tone motives is significantly lower when compared with the prints made by using the AM screening method. The classical rosette and tone gradations are visible better reproduced by using the FM screening method.
6. Conclusion
With the development of the digital technology a new step forward has been made in the screening technologies as well. The reasons? Better quality results, more stable processes and, hopefully, reduced operating costs. The scientific investigations have shown that FM screening method might result with the visually better prints, but the instrumental measurings show that these prints actually need improvements. There fore in order to achieve optimal prints it is necessary to obtain the stability of the system with the usage of the colour management (Mahovic et al., 2003). New screening systems, called transitional screening, which combine different types of screening on different parts of the plate, have been introduced with the aim of achieving the mention objective. Stochastic algorithms are used for the highlight and shadow areas of images, while AM screens are used for the midtones as well as for solid coverage areas ( Hamilton , 2004). The reason is that stochastic excels in highlights, but struggles with dot gain in the midtones, while AM screening is best suited to these areas. Combining of these two screening methods enables printers to achieve far better image quality than using either one alone. Such screening method will use the advantages of both AM and the FM screening and eliminate their disadvantages in order to achieve a higher reproduction quality.
7. References
Adams Richard, M. & Romano, F. (1996). Computer to Plate: Automating the PrintingIndustry , Graphic Arts Technical Foundation , USA
Agic, D.; Mandic, L. & Gojo, M. (1999). Influence of Some Parameters on the Change of Printing Elements Dimension, Proceedings of 10 th International Daaam Symposium, Katalinic, B., pp. 5-6, ISBN 3-901509-10-0, Vienna, October 1999, DAAAM International Vienna, Austria
Fairchild, M. D. (1998). Color appearance models , Addison-Wesley, ISBN 0-201-63464-3, Reading , MA
Hamilton, A. (2004). What's happening with screening techniques for package printing?, http://www.convertingmagazine.com/columns/columns.cgi?file=2_04_24.html, 2004-03-09
Hunt, R. W. G. (1991). Measuring Colour, Ellis Horwood Limited, ISBN 0-13-567686-X, England
Kipphan, H. (2001). Handbook of Print Media, Springer, ISBN 3-540-67326-1, Berlin
Levien R. (1995). Will this new technology replace halftones in printing?, http://www.wired.com/wired/archive/3.02/geek.html, 2003-15-12
Mahovic, S.; Agic, D. & Gojo, M. (2003). Mechanical and Optical Differences in Long Run Printing in Conventional and CtP Offset Systems, Proceedings of IARIGAI, Lovrecek, M. (Ed.), pp. 213-221, ISBN 953-96276-8-0, Dubrovnik-Cavtat, September 2003, Acta Graphica Publishers, Croatia
Mahovic, S.; Mandic, L.; Agic, D. & Gojo, M. (2003). Optical Comparison of Reproduction in the Closed Graphic Systems, Proceedings of 14 th International Daaam Symposium, Katalinic, B., pp. 281-282, ISBN 3-901509-34-8, Sarajevo, October 2003, DAAAM International Vienna, BiH
Wadle, H. & Blum D. (2002). An Introduction to Screening Technology, http://www.heidelberg.com, 2003-02-17
Ward , G. (2003). Computer to Plate - Stars of the thermal screen, http://www.dotprint.com/technology/prepress/ctp/020.shtml
Wyszecki, G. & Stiles, W.S. (1982). Color Science: Concepts and Methods, Quantitative Data and Formulae-2nd Edition, John Wiley & Sons, ISBN 0-471-02106-7, Canada